Key points: (1) Change the download address of the program to RAM space
(2) Set the SP before the debug of the program, the PC pointer to the Ram space
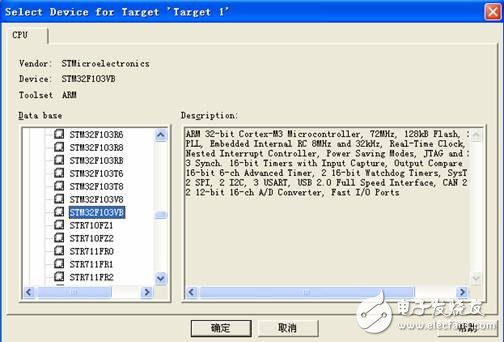
New project, select the specific model of STM32, I bought the development board of Wanli, choose stm32f103Vb.

Set the program download address, as shown in the figure below, the address of IROM1 points to the ram space of STM32.

How the size of the space is allocated depends on its own needs. The internal ram size of this processor is 20K, 16K is allocated to the read-only area, and 4K is given to the readable and writable area. Thus, the size of the IROM setting is 0x4000, and the start of IRAM1 becomes 0X20004000, leaving only 0X1000.
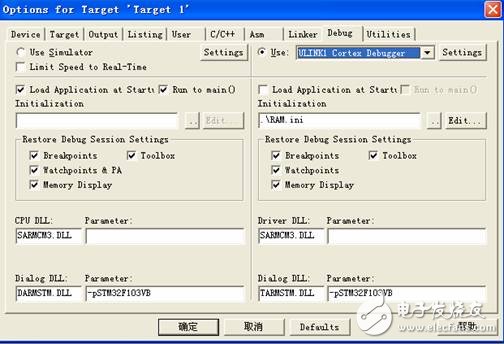
The Debug tab selects ULINK1 Cortex Debugger (the software uses the yjgyiysbCC brother crack method). Do not select Load ApplICaTIon at Start, add the startup script RAM.ini to IniTIalizaTIon.

The details of RAM.ini are as follows:
FUNC void Setup (void) {
SP = _RDWORD(0x20000000); // Setup Stack Pointer
PC = _RDWORD(0x20000004); // Setup Program Counter
_WDWORD(0xE000ED08, 0x20000000); // Setup Vector Table Offset Register
}
LOAD XXX.axf INCREMENTAL // Download, red for project file name.axf
Setup(); // Setup for Running
g, main
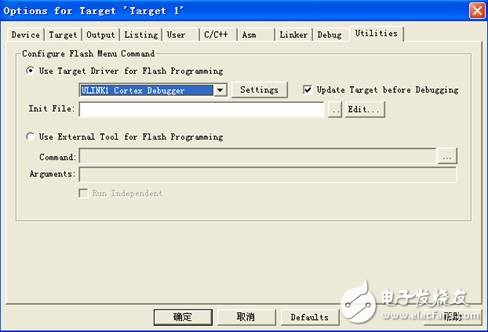
Update Target before Debugging is not selected under UTIlities
After this is added, it can be debugged in RAM.
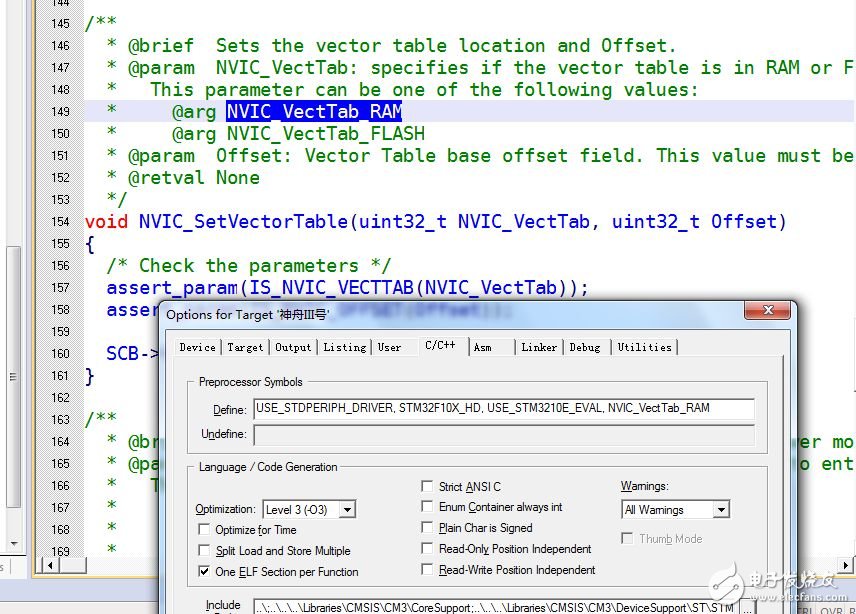
>>>>>> We need to set the correct interrupt vector table position in the code. The interrupt vector table is usually placed at the beginning of the user program, so when running in flash, the vector table is at 0x08000000, and when the code is placed in SRAM, its position becomes 0x20000000. When initializing NVIC, we can place the following code to define the location of the vector table.
NVIC_SetVectorTable(0x20000000, 0x0);
or
NVIC_SetVectorTable(0x08000000, 0x0);
or

>>>>> Debug item in the project option, in the Download tab, remove all hooks, do not download the code to flash, so you can debug the program in RAM!
2. Debugging in FlashAfter the new project is created, the system sets the address and space size of IROM1 to FLASH by default. It only takes two steps:
1) Set the debugging tool to ULINK1 CORTEX DEBUGGER, as shown below, you do not need to set the start script.

2) Set ULINK1 cortex debugger in Utility and set the programming algorithm. As shown below.


After that, you can debug FLASH.
Hardware: Wanli's EK-STM32F development board, hardware removes RS3, RS4 exclusion, and disconnects the emulator of the development board itself.
Software: KEILMDK3.20+ULINK driver replacement file.
- [Compact Design & Family-Sized:]Compact design frees valuable desk space while non-slip grip keeps it from being knocked off. 6 high powered ports lets you charge any combination of phones, tablets or other USB-charged devices simultaneously
Brand Name: OEM
Product Name: Multi USB Charger
Use: Mobile Phone
Place of Origin: Guangdong, China (Mainland)
Port: 6 port
Input: AC100-240V 50/60HZ
Size: 90*70*16mm
Weight: 250g
Materials: PC+ABS
Color: Black/White
Warranty: 1 year
Multi USB Charger,Multi Usb Wall Charger,Multiple Usb Port Charger,Multi Port USB Charger
Shenzhen Waweis Technology Co., Ltd. , https://www.waweispowerasdapter.com